Nidhi's 2019 Year In Review
32
Dramas Completed
0
Movies Completed
32
Ratings
0
Reviews
10
Comments
0
Votes
Dramas

Drama Time
75
Total Episodes
75
Total Hours
6.3
Per Month
6.2
Per Month
1.4
Per Week
1.4
Per Week
Ratings
Your Top Rated Dramas
All Your Drama Ratings
Watchlist Updates
Most Updates To Your Watchlist: August
Most Updates To Your Watchlist: Thursday
Longest Streak Of Updates: 4 Days
Drama Attributes
Your Top Genres, Tags And Countries
Netflix Is Your Most Watched Network
Netflix 28 shows
When the Camellia Blooms, When the Camellia Blooms,…
tvN 10 shows
Hotel del Luna, Cheese in the Trap, Touch Your Heart
KBS2 9 shows
Hit the Top, When the Camellia Blooms, School 2017
jTBC 6 shows
Eulachacha Waikiki, The Light in Your Eyes, My ID…
Movies

Movie Time
0
Total Movies
0
Total Hours
0
Per Month
0
Per Month
0
Per Week
0
Per Week
Ratings
Your Top Rated Movies
People

Most Watched Actresses
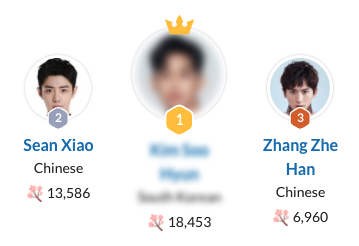
Most Watched Actors
Most Watched Directors
Most Watched Screenwriters
Thanks For A Great Year, Nidhi!


